“Intelligence is about to be a commodity.”
— Jensen Huang, NVIDIA CEO, 2025 [¹²]
This single statement defines the shape of the entire AI industry in 2030.
這一句話,定義了整個 AI 產業 2030 年的形狀。
For the past two decades, the pricing unit for SaaS has been the subscribed user — Salesforce, Slack, and Microsoft 365 all monetize on a per-user basis. But what Huang meant is that AI’s pricing unit isn’t the “human”; it’s the token. A token is fundamentally different from a subscription: it is a metered output, akin to a kilowatt-hour of electricity, a cubic meter of natural gas, or a barrel of crude oil. If intelligence truly is a commodity, then the pricing logic of generative AI is essentially that of a public utility — not software subscription.
Commodity markets share a distinct characteristic: their scale can be estimated. You have volume on one side and price on the other. Goldman Sachs provided us with one curve, and the launch pricing of 50 models over the past five years gave us the other. Multiply the two, subtract the underlying electricity costs (the true marginal cost in a commodity market), and you get an estimable market size. The conclusion? It is smaller than you might expect.
The Engine of Volume: 120 Quadrillion Tokens per Month // 量的引擎:每月 120 千兆 token #
In May 2026, Goldman Sachs published its Agentic AI analytical report. The headline figure became the anchor for all downstream calculations in this article: token consumption will multiply by 24× between 2026 and 2030, reaching 120 quadrillion tokens per month by 2030 — covering the total token volume across all global AI inference scenarios. [¹]
This number is so astronomically large that it loses its intuitive meaning. Let’s convert it:
這個數字大到讓我們失去感覺,換算一下:
Per-capita normalization // 人均換算:
\[
1.44 \times 10^{18} \text{ tokens} \div 8 \text{ B people} \approx \mathbf{180 \text{ M tokens per person, per year}}
\]
Translated into reading volume, this is equivalent to every human on Earth digesting 360 books’ worth of AI-generated text per year. Of course, that’s not the reality — the vast majority of these tokens will be consumed by software, not humans. Agents talking to agents, agents talking to APIs.
換算成閱讀量,相當於全人類每人每年消化掉 360 本書份量的 AI 生成文字。當然,現實不是這樣——絕大多數的 token,會由軟體消化掉,而不是人。Agent 在跟 agent 對話、agent 在跟 API 對話。
This is the “volume” side of the equation. The truly fascinating work happens on the “price” side.
這就是公式裡「量」的這一邊。真正有意思的工作,發生在「價」的那一邊。
The Price Curve: A Dual-Track Structure of Frontier and Commodity Models // 價的曲線:前沿模型與大眾模型的雙軌結構 #
In November 2024, Andreessen Horowitz’s Guido Appenzeller coined the term “LLMflation” to describe what he called “the fastest cost-deflation curve in tech history”: assuming fixed model capabilities, inference prices drop by 10× annually. [²] Epoch AI’s March 2025 follow-up was even more aggressive — depending on the benchmark, annual price decay for equivalent capabilities ranged from 9× to 900×, with a median of 50×, accelerating to 200× after January 2024. [³]
But these figures measure capability-adjusted prices. They tell you how much cheaper a GPT-4 tier model becomes, not what people will actually pay for inference in 2030. The frontier keeps moving up. Buyers in 2030 won’t be paying for GPT-4 capabilities; they will be paying for the frontier of 2030.
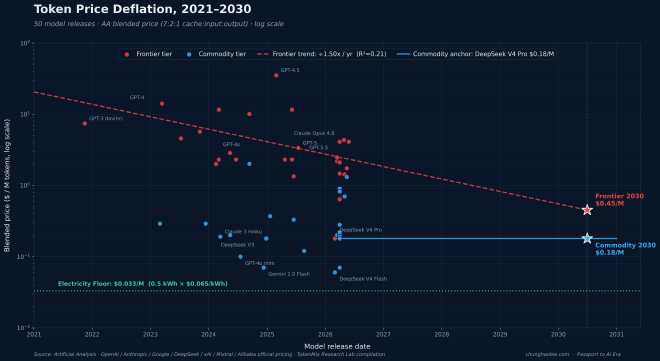
To forecast revenue, we look at absolute prices — the actual unit prices announced at the time of each model’s release. We built a dataset of 50 models, from GPT-3 davinci in November 2021 to Claude Opus 4.8, GPT-5.5, and the DeepSeek V4 series in mid-2026. The blended price uses Artificial Analysis’s standard 7:2:1 (cache : input : output) weighting, with cache priced at 10% of input. [⁴]
Cost-optimized variants from major vendors (mini, flash, haiku, nano) plus open-source commodity models. Regression across 23 samples shows a near-zero slope, so we abandon the regression and use a single anchor: DeepSeek V4 Pro at $0.18/M — the flagship of the most representative commodity-tier vendor, serving as the benchmark for current commodity capability. Holding flat through 2030:
各家廠商發布的成本最佳化變體(mini、flash、haiku、nano)以及開源大眾模型。對 23 個樣本跑回歸時斜率幾乎為零,所以大眾層不用回歸線,改用一個錨點:DeepSeek V4 Pro = $0.18/M——大眾層中最具代表性開源模型的旗艦,作為「大眾層當下能力的對標基準」。同樣的策略套到 2030 年:
Commodity 2030 blended price = $0.18 / 1M tokens
Two lines, one structure: $0.45/M vs. $0.18/M, a 2.5× spread. This ratio is the core geometry of the 2030 inference market.
兩條線、一個雙軌結構:$0.45/M vs. $0.18/M,差 2.5 倍。這個比例就是 2030 年推理市場的核心幾何。
Three Scenario Calculations: Deriving the Revenue Pool // 三個情境算式:營收池的推導 #
By fixing volume at 1.44 quintillion tokens per year and bracketing price with the two anchors, the revenue pool resolves into three scenarios. What we are calculating is the implied market size of the entire token economy at API-equivalent pricing — not pure API revenue, but the total volume × the equivalent ASP (Average Selling Price) converted from all monetization formats (subscriptions, enterprise contracts, embedded usage) at API blended price.
把量固定在每年 1.44 百萬兆 token,價格用兩個錨點界定,營收池分解成三個情境。這裡算的是「整個詞元經濟在 API 等價定價下的隱含市場規模」——不是純 API 營收,而是把所有形式(訂閱、企業合約、內嵌使用)以 API blended price 換算後的 ASP(Average Selling Price,平均售價)× 總量。
The three scenarios converge into a defensible range: $259B to $648B, baseline $337B. For calibration: Bain & Company’s 2024 AI market estimate puts AI products and services TAM at $780–990 B by 2027 (including the entire application layer) [⁵]; McKinsey’s broader GenAI economic value estimate runs $2.6–4.4 trillion annually (including productivity gains) [⁶]. Our calculation captures only “revenue driven by pure tokens” — a subset of the TAM (Total Addressable Market) corresponding specifically to the inference layer.
三個情境收斂在合理區間:$259B 到 $648B,基準估計 $337B。對標 Bain & Company 2024 年估算(2027 年 AI TAM $780–990 B,含整個應用層)[⁵],與 McKinsey 廣義 GenAI 經濟價值(每年 $2.6–4.4 兆,含生產力收益)[⁶]——我們算的是「純詞元帶來的營收」(TAM, Total Addressable Market 中對應推理層的子集)。
The Power Floor: What Remains After Stripping Down Costs // 電力底線:把成本拆解剩下的那一層 #
If the price curve constantly approaches marginal cost, what is marginal cost actually made of? Here the analysis gains real predictive power — at extreme token volumes, the cost of a single token is roughly equal to the cost of the electricity to produce it.
Today’s full inference TCO (Total Cost of Ownership) breakdown: GPU amortization 40–50%, electricity 15–25%, networking and cooling 15%, software ops 10%, training amortization 5–10% (per SemiAnalysis and Epoch AI teardowns of H100-class deployments) [⁷]. Electricity is a minority share — but that is because today’s volume is small. At 120 quadrillion tokens per month in 2030, all fixed costs amortize to near zero. What remains is variable cost. And variable cost is overwhelmingly electricity.
We assume 0.5 kWh per million tokens — a mid-2030 average for a workload mix dominated by efficient MoE (Mixture-of-Experts) architectures and smaller models, sharply down from Epoch AI’s 1–5 kWh/M for today’s GPT-4o, reflecting 5–8× efficiency gains across the Blackwell → Rubin → Vera Rubin roadmap. [⁸]
This roughly equals the combined annual electricity consumption of France (~430 TWh) and the United Kingdom (~280 TWh) [¹⁰], or about 18% of total US electricity demand.
In other words, AI inference alone in 2030 will impose a power burden equal to two major European economies — which is why hyperscalers began signing 20-year nuclear PPAs in 2024.
換句話說,2030 年光是 AI 推理本身,就是一個歐洲兩大經濟體規模的用電負擔——這也是為什麼超大規模雲廠商從 2024 年起就開始大舉跟核電業者簽 20 年期 PPA。
Hypothetical Deduction: What If Everyone Uses DeepSeek in 2030? // 假想推理:如果 2030 年大家都用 DeepSeek #
This is the scenario most worth putting on the table.
接下來是這篇文章最值得放在桌上推一遍的情境。
At 120 quadrillion tokens per month, fixed costs amortize to near zero, leaving only the electricity variable cost line. If by 2030, at the current iteration velocity, even open-source ultra-cheap models like DeepSeek (priced at $0.06–$0.18/M) reach a “good enough” capability level — good enough to write emails, summarize documents, run customer service agents, handle most RAG (Retrieval-Augmented Generation) and tool-calling — what happens?
The answer: the vast majority of buyers will choose DeepSeek-tier models because they are cheap. Only a tiny fraction of use cases demanding peak cognitive power (frontier research, quant finance, drug design, complex agentic planning) will employ frontier models.
This is the inflection point of the article.這就是這篇文章的拐點。
Goldman’s 120 quadrillion token volume × a commodity-heavy mix (95% at V4 Pro pricing) yields a market of $279 B. Strip out electricity, and the net value pool comes to $232 B. Against the combined 2025 AI CapEx of Microsoft, Google, Meta, and Amazon (already past $300 B/year) [¹¹], even this baseline-adjacent scenario falls short of the capital outlay.
In other words, if commodity capability crosses “good enough” and absorbs 95% of workload by 2030, Goldman’s 120 quadrillion is still not enough. Reverse-engineering what would be required for a $1 trillion market:
To prop up a $1 T market at Goldman’s volume, average unit price must hold around $0.70/M — close to today’s Mistral Medium 3.5 ($2.10) or Kimi K2.6 ($0.70). This means the market cannot fully succumb to DeepSeek-ification; massive token volume must remain in frontier and mid-tier bands.
要支撐 $1 兆市場,平均單價必須維持在 $0.70/M 左右——接近今日 Mistral Medium 3.5($2.10)或 Kimi K2.6($0.70)的水準。這意味著市場不能完全 DeepSeek 化,必須有大量 token 停留在前沿與中價帶。
This reverse path reveals a conclusion unstated in Goldman’s report but deeply embedded in its forecast: the trillion-dollar AI inference narrative requires two things to happen simultaneously — Goldman’s volume must materialize, and the market must avoid full commoditization, with prices anchoring in the middle band. If either fails, the narrative collapses.
這條反推路徑指出一個沒被高盛報告本身點明、但隱含在那份預測裡的結論:整個兆美元 AI 推理市場敘事,需要兩件事同時發生——一是高盛預測的量真的出現,二是市場沒有完全 DeepSeek 化、價格能停在「中間帶」。少了任一條,敘事就不成立。
Silicon Valley’s Second Half: Two Numbers Dictating the Future // 矽谷的下半場:兩個數字,決定未來走向 #
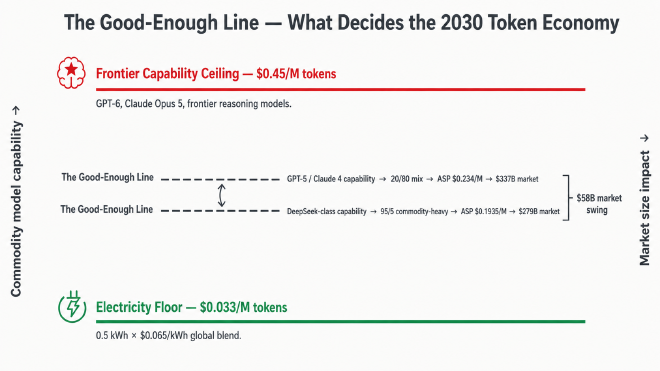
The trajectory of the token economy is decided by a tug-of-war: model capability curve above, electricity floor below, the dynamic “good enough” line moving between them.
Two scenarios, one order of magnitude apart // 兩個情境、相差一個量級 #
If “good enough” line lands at…
ASP
Market
Post-power
Margin
GPT-5 / Claude 4 capability tier 等級(20/80 baseline)
$0.234/M
$337 B
$290 B
86%
DeepSeek V4 Pro capability tier 等級(95/5 commodity-heavy)
$0.1935/M
$279 B
$232 B
83%
If “good enough” stalls near GPT-5 / Claude 4 — meaning a tangible capability gap remains for true frontier applications (multi-step reasoning, scientific discovery, complex agentic planning) — the 80/20 blended ASP holds above $0.234/M. Goldman’s 120 Q volume supports a baseline $337 B market, $290 B post-electricity, 86% gross margin. A healthy market, but still some distance from a trillion dollars.
如果「夠用」的水平線在 2030 年之前停在 GPT-5 / Claude 4 這個高度——真正前沿應用跟大眾模型有實質落差,需要使用前沿模型——那 20/80 法則的混合 ASP 維持在 $0.234/M 以上,高盛的 120 千兆量撐起 $337 B 的基準市場,扣電後 $290 B,毛利率 86%。健康市場,但跟「兆美元」還有一段距離。
If “good enough” drops to DeepSeek-class — commodity models swallow 95% of commercial agentic workloads — Goldman’s volume still produces a $279 B market, $232 B post-electricity, 83% gross margin. Goldman’s 120 Q would need to multiply by ~3.6× to reach a trillion-dollar market under this mix. Otherwise the market settles in the $259–337 B band — a healthy revenue pool, comparable in scale to today’s global SaaS market (~$320 B), but persistently below the combined $300 B+ Big Four AI CapEx.
如果「夠用」的水平線降到 DeepSeek 等級——大眾模型吃掉 95% 的商業 agentic 工作負載——高盛的量還是能撐起 $279 B 的市場,扣電後 $232 B,毛利率 83%。要走到兆美元規模,量需要再翻 約 3.6 倍。否則整個市場停留在 $259–337 B 區間——一個與今日全球 SaaS 市場規模(~$320 B)相當的健康營收池,但持續低於 Big Four 累計 $300 B+ 的 AI 資本支出。
Where the “good enough” line moves fundamentally depends on how high commodity models can push their capabilities before 2030. If open-source MoE architectures, DeepSeek-style training efficiency, and next-generation budget inference hardware enable commodity models to cover the vast majority of commercial agentic workloads, the market converges on price naturally. Frontier pricing power will not be held by model vendors; it will be dictated by the commodity capability curve.
[⁵] Bain & Company, Technology Report 2024: AI Market — 2027 AI TAM $780–990B(含應用層)
[⁶] McKinsey Global Institute, The economic potential of generative AI, Jun 2023 — 年經濟價值 $2.6–4.4 兆(含生產力)
[⁷] SemiAnalysis, Inference Race To The Bottom, Dec 2023 + InferenceX 系列 newsletter.semianalysis.com · Introl Blog, Inference Unit Economics, Feb 2026 introl.com
[⁸] Epoch AI, How much energy does ChatGPT use?epoch.ai/gradient-updates — GPT-4o 每次 query ≈ 0.3 Wh。本文 0.5 kWh/M 為 2030 假設,含 Blackwell → Rubin 5–8× 效率提升
[⁹ᵃ] China Briefing 2025 · TechChannel 2025(內蒙古/貴州/甘肅補貼至 ¥0.4/kWh)