A modern thousand-cabinet data center runs roughly one million sensors — measuring voltage, current, temperature, humidity, airflow, vibration, leak detection, door status, fan speed — and writes each measurement to a database every few seconds. A year of telemetry from a single facility exceeds two terabytes of raw data. The data center industry passed the threshold where a human team could meaningfully read its own facility about ten years ago. The only feasible response has been to put software in charge of the reading, and increasingly, in charge of the deciding.
Why Operations Has Its Own Software Stack // 為什麼運維需要自己的軟體堆疊 #
The combination of scale, real-time response requirements, and the rising cost of operator errors has created the modern operations software stack for data centers. The umbrella name for that stack is DCIM — Data Center Infrastructure Management — but the term covers a wider territory than most outsiders expect. It spans asset inventory, capacity planning, environmental monitoring, power and cooling control, alarm management, workflow, reporting, and increasingly, AI-driven optimization that runs continuously underneath the human operators.
規模、即時響應要求、加上運維錯誤成本上升,三件事合在一起催生了數據中心的現代運維軟體堆疊。這個堆疊的傘狀名稱是 DCIM(Data Center Infrastructure Management,數據中心基礎設施管理) —— 但這個詞涵蓋的領域比大多數外行人預期的要寬:資產清冊、容量規劃、環境監控、電力與冷卻控制、警報管理、工單流、報表,以及越來越多在運維人員底下持續跑的 AI 驅動優化。
This article walks through what DCIM actually is, how its modules are organized, the reference architecture from one of the industry’s most-deployed examples, and the AI-driven extensions — Huawei iCooling, Huawei iPower, Google DeepMind cooling control — that have moved from research curiosity to standard procurement in roughly five years.
Part 1 — DCIM, BMS, and EMS: The Distinction That Matters // 第一部分:DCIM、BMS、EMS —— 重要的區分 #
Three acronyms get confused in this space, and the confusion has real procurement consequences. They overlap but solve different problems.
這個領域裡三個縮寫常被混淆,而混淆會造成實際的採購後果。它們有重疊但解決不同問題。
System
What it manages // 它管什麼
Typical vendors // 典型廠商
BMS (Building Management System)
Whole-building services: HVAC, lighting, elevators, security, fire 整棟建物服務:HVAC、照明、電梯、安防、消防
Honeywell, Siemens, Johnson Controls
EMS (Energy Management System)
Electrical energy specifically: consumption monitoring, demand management, billing 專注電力能源:用電監控、需量管理、計費
Schneider EcoStruxure Power, ABB
DCIM (Data Center Infrastructure Management)
The data center as a system: facility + IT integration, capacity, workflow, real-time alarming 把數據中心當系統管:設施 + IT 整合、容量、工單、即時告警
Schneider, Sunbird, Nlyte, Vertiv, Huawei
The critical difference is that DCIM was built specifically for the operational pattern of a data center: dense sensor coverage, IT-system integration, sub-second alarm response, capacity planning at the cabinet level, and increasingly close coupling between the facility-side and the IT-side telemetry.
關鍵差別是 DCIM 是專門為數據中心的運轉模式而建:密集感測器覆蓋、IT 系統整合、亞秒級警報響應、機櫃層級的容量規劃、以及越來越緊密的設施側與 IT 側遙測耦合。
A BMS specified for a data center misses about 40% of what an operator actually needs to do. The mistake is expensive, because the visible work — temperature monitoring, alarm dashboards — looks similar enough that the gap only shows up at the first major incident.
Part 2 — The Four Generations of DCIM // 第二部分:DCIM 的四個世代 #
DCIM as a category has evolved through four reasonably distinct generations, each layering new capabilities on top of the previous:
DCIM 作為一個類別經歷了四個算是明顯的世代,每個世代在前一代上疊上新能力:
Generation 1 (2000–2010): BMS / EMS era
- Basic monitoring and alarms
- Vendor-by-vendor PLC and DDC systems
- Question answered: "Is anything broken?"

Generation 2 (2010–2015): Traditional DCIM
- Schneider StruxureWare, Vertiv Trellis era
- Multi-vendor equipment integration
- Asset management and capacity planning
- Question: "What do I have and how full am I?"

Generation 3 (2015–2020): Cloud-Native DCIM
- Sunbird, Nlyte, Device42
- API-first, modern UI, workflow automation
- IT-system integration deepens
- Question: "How do I run this end-to-end?"

Generation 4 (2020–present): AI-Driven DCIM
- iCooling, iPower, EcoStruxure with ML
- Predictive maintenance, autonomous optimization
- Edge compute and continuous learning
- Question: "What should I be deciding right now?"
Most facilities running today sit somewhere between Generation 2 and Generation 3. Hyperscalers and a small set of leading colocation operators sit in Generation 4. The gap is widening.
Security telemetry — Door access, IP cameras, motion sensors
安防遙測 —— 門禁、IP 攝影機、動作感測器
IT telemetry — Server SNMP, switch SNMP, IPMI, Redfish
IT 遙測 —— 伺服器 SNMP、交換機 SNMP、IPMI、Redfish
The protocols underlying this layer are a heterogeneous mix: Modbus and RS-485 for legacy power equipment, SNMP for IT-side devices, BACnet for building systems, Profinet and OPC-UA for industrial-grade equipment. Modern DCIM platforms include a protocol abstraction layer that normalizes all of this into a common data model.
This is where the platform meets the operator. The application layer hosts dashboards, capacity planning tools, alarm consoles, workflow automation, reporting engines, and — increasingly — AI optimization loops that run autonomously underneath.
這是平台跟運維人員見面的地方。應用層裝載儀表板、容量規劃工具、警報控制台、工單自動化、報表引擎、以及越來越多在底下自主跑的 AI 優化迴路。
The data volumes at the sensor layer are large enough that this layered separation is not optional. A single thousand-cabinet facility produces around one million telemetry measurements per second at peak sampling rates. Storing, indexing, and serving that flow requires the same kind of data infrastructure used by large web services.
Part 4 — The Eight DCIM Functional Modules // 第四部分:八個 DCIM 功能模組 #
Across vendors, DCIM platforms have converged on roughly the same eight functional modules. When evaluating a platform, the eight-module checklist is the cleanest way to map what a vendor actually offers against what an operator actually needs.
Real-time answers to: which U positions are free, which PDUs have headroom, how much cooling margin remains in each zone, which switches have port capacity. The standard question is “I want to add 50 GPU servers — where can they go?”
即時回答:哪些 U 位是空的、哪些 PDU 有餘量、每個區域剩多少冷卻 margin、哪些交換機還有 port 容量。標準問題是「我要新增 50 台 GPU 伺服器 —— 可以放哪?」
Real-time temperature, humidity, water leak detection, smoke detection — at the rack inlet and exhaust, in equipment rooms, in containment zones. Heat-map visualization across the floor plan.
Voltage, current, power, power factor, harmonics, frequency — at every measurement point in the power chain. UPS battery state of charge and state of health. Genset run hours, fuel level.
Change requests, approval flows, Method of Procedure (MoP) documents, post-change verification. This is the module that catches “did the technician actually re-connect everything before leaving?”
變更請求、簽核流程、MoP(Method of Procedure,標準作業程序)文件、變更後驗證。這是抓住「技師離開前真的把所有東西接回來了嗎?」的模組。
No single platform is best at all eight. Procurement comes down to which modules matter most for the specific facility profile — a colocation operator needs strong capacity and workflow; a hyperscale operator needs strong efficiency and power; an enterprise EDC needs balanced coverage.
沒有單一平台在八個模組都最好。採購歸結到「對特定機房類型,哪些模組最重要」 —— Colocation 業者需要強的容量與工單;hyperscaler 需要強的能效與電力;企業 EDC 需要平衡的覆蓋。
Part 5 — A Reference Architecture: Huawei ECC800 + NetEco 6000 // 第五部分:參考架構 —— 華為 ECC800 + NetEco 6000 #
Huawei’s deployment, while not the only mainstream example, is one of the most documented and a useful illustration of how a modern DCIM stack is physically laid out.
Each prefabricated module or equipment cluster gets an ECC800-Pro edge controller. The ECC800 is the module-level “brain” — it consolidates everything inside the module and presents a clean interface upstream.
The protocols flowing upward into the controller are mixed — Modbus, SNMP, RS-485, analog inputs, digital inputs, TCP/IP — and the ECC800 normalizes all of these into a single TCP/IP feed.
NetEco 6000 sits above the ECC800 layer. Multiple ECC800 controllers — one per prefabricated module, potentially hundreds across a large campus — feed up into a central NetEco 6000 server that provides cross-module visibility, capacity planning, energy reporting, and a SNMP northbound interface for integration with higher-level systems.
The marketing framing Huawei uses for this is “N to 1” — N pieces of equipment, 1 unified view. The five “1"s:
華為對這個的行銷說法是「N to 1」 —— N 個設備、1 個統一視角。五個「1」是:
One brain — ECC800-Pro consolidating one module
一個大腦 —— ECC800-Pro 整合一個模組
One screen — A 10-inch tablet or 43-inch smart screen showing all subsystems
一個螢幕 —— 10 吋平板或 43 吋智能螢幕顯示所有子系統
One interface — SNMP northbound for third-party integration
一個介面 —— SNMP 北向給第三方整合
One phone — SMS alerts for critical events
一支電話 —— 重大事件 SMS 告警
One network — Web-based remote monitoring
一個網路 —— Web 遠端監控
The underlying observation that makes this framing land with customers: the single biggest pain point of data center operations is “N different vendors, N different protocols, N different interfaces, N different on-call teams.” The value of a unified platform is exactly the unification.
Part 6 — iCooling: AI-Driven Cooling Optimization // 第六部分:iCooling —— AI 驅動冷卻優化 #
The AI-driven extension that has received the most public attention is iCooling — a closed-loop machine-learning system that continuously adjusts cooling setpoints across the facility to minimize energy consumption while maintaining temperature and humidity guarantees.
最受公眾關注的 AI 驅動延伸是 iCooling —— 一個閉環機器學習系統,持續調整整個機房的冷卻設定點,在維持溫度與濕度保證的同時最小化能耗。
Traditional cooling control runs static setpoints — chilled water at 7°C, room air at 22°C — chosen at commissioning and rarely changed afterwards. The setpoints have to be conservative because they cannot adapt: the cooling system has to be cold enough to handle peak load on the hottest day, which means it runs over-cold for most of the year.
Huawei iCooling at Qinghai (Hainan, China) renewable-powered campus — 96 in-row cooling units coordinated, ~8% reduction in cooling energy, translating to roughly 0.05–0.1 PUE improvement
Google DeepMind cooling control (widely cited 2016 case) — reinforcement learning controlling one of Google’s data centers, reported 40% reduction in cooling energy, overall PUE improvement of roughly 15%
Google DeepMind 冷卻控制(2016 年廣為引用的案例)—— 用強化學習控制 Google 一座數據中心,報告冷卻能耗降低 40%,整體 PUE 改善約 15%
The Google number is the headline most people quote. The Huawei number is more representative of what a typical new deployment will see — the Google case was an unusually aggressive setup with significant baseline headroom.
Google 那個數字是多數人引用的標題。華為那個數字比較代表典型新部署會看到的效果 —— Google 的案例是相當積極的設定,且有顯著的基線改善空間。
AI-driven cooling control has crossed the threshold from “research project” to “standard procurement requirement” in roughly five years. Any new hyperscale or large-colocation specification today expects an AI optimization layer in the cooling stack.
AI 驅動的冷卻控制在約 5 年內跨過了從「研究專案」到「標準採購要求」的門檻。任何新的 hyperscale 或大型 Colocation 規格今天都預期冷卻堆疊裡有一層 AI 優化。
The power-side analogue of iCooling is the family of predictive maintenance systems that monitor electrical equipment for early warning of failure. Huawei calls its version iPower; competitors offer similar capabilities under different names.
A typical predictive-maintenance economic analysis for a thousand-cabinet facility, with 500 UPS modules:
千機櫃機房、500 個 UPS 模組的典型預測性維護經濟分析:
Line item
Traditional PM
PdM
Forced replacement frequency 強制更換頻率
100 modules/yr × $5K = $500K
60 modules/yr × $5K = $300K
Emergency repairs 緊急搶修
5/yr × $50K = $250K
0.5/yr × $50K = $25K
Platform OPEX 平台 OPEX
$0
$100K/yr
Annual total
$750K
$425K
Annual saving
—
$325K
With a $300K platform CAPEX, payback comes in just under one year. Three-year ROI is roughly 225%. The math works for any facility above a few hundred cabinets.
平台 CAPEX $300K,回本剛好一年。三年 ROI 約 225%。對任何幾百櫃以上的機房,這個數學都成立。
Part 8 — Digital Twin and 3D View // 第八部分:數位孿生與 3D 視圖 #
The visual front-end of modern DCIM is increasingly a digital twin — a real-time, three-dimensional model of the facility that mirrors the physical layout, color-codes status, animates airflow, and supports zoom-and-rotate navigation.
The 43-inch smart screens in Huawei’s modular product line are a representative example. They host three primary views:
華為模組化產品線裡的 43 吋智能螢幕是代表性例子。它們承載三個主要視圖:
Overall view — Module layout, current PUE, alarm count, environmental status, access control
整體視圖 —— 模組布局、當前 PUE、警報數、環境狀態、門禁
Power view — Utility input, UPS, distribution chain visible end-to-end with live electrical measurements
電力視圖 —— 市電輸入、UPS、配電鏈完整可見,附即時電氣量測
Cooling view — Indoor unit, outdoor unit, fan and compressor speeds, real-time refrigerant capacity, aisle temperature maps
冷卻視圖 —— 室內機、室外機、風扇與壓縮機轉速、即時冷媒容量、通道溫度地圖
The digital twin layer matters operationally because it dramatically shortens the time to understand a complex situation. An operator opening a dashboard sees the relevant data immediately in context; an operator working from raw alarm streams has to mentally reconstruct the same picture.
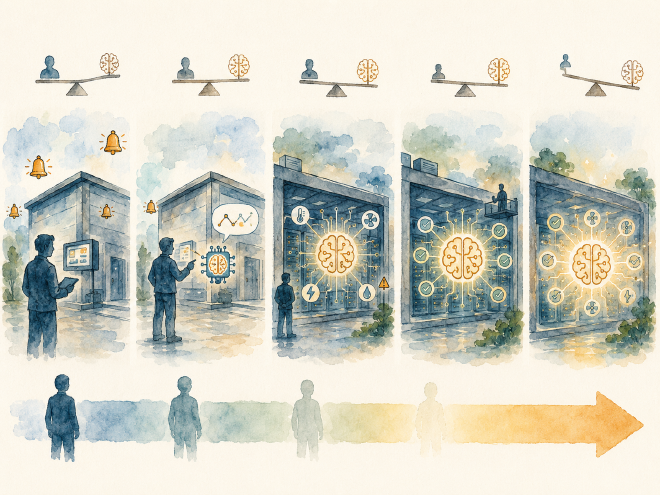
Part 9 — Autonomous Operations: L1 to L5 // 第九部分:自動駕駛運維 —— L1 到 L5 #
The framing the industry has gradually adopted for the long-term direction of operations is a five-level autonomy scale, modeled on the automotive industry’s SAE levels for self-driving cars.
業界對運維長期方向逐漸採用的框架是 五級自動駕駛量表,類比汽車產業的 SAE 自駕等級。
Level
Name // 名稱
Description // 描述
L0
Manual
All monitoring and decisions made by humans; alarms via static thresholds 全部監控與決策由人類做;靜態門檻產生警報
L1
Alert-assisted
System raises alerts; operator decides 系統發警報;運維人員決策
L2
Partial automation
AI suggests actions; operator confirms AI 建議動作;運維人員確認
L3
Conditional automation
AI handles known scenarios automatically; operator intervenes for novel events 已知場景 AI 自動處理;新情境運維人員介入
L4
High automation
Most scenarios handled by AI; humans intervene only in extreme events 多數情境 AI 處理;極端事件人類才介入
L5
Full autonomy
No human intervention required; entirely AI-managed 不需要人類介入;完全由 AI 管理
Hyperscalers (Google, Meta, Microsoft internal): L2–L3
L4 facilities: Experimental, demonstrated at a handful of sites
L5: Not yet realized at any production facility
The gap between leading hyperscalers and mainstream operators is widening, mainly because the leading hyperscalers have both the data volume to train sophisticated models and the engineering capacity to deploy them.
1. A modern facility produces too much telemetry for humans to read // 現代機房產出的遙測對人類太多 #
A thousand-cabinet site has roughly one million sensors and produces more than two terabytes of telemetry per year. DCIM exists because the data center industry passed the threshold of human cognitive capacity about a decade ago.
2. DCIM is different from BMS and EMS // DCIM 跟 BMS、EMS 不同 #
A BMS specified for a data center misses about 40% of what an operator needs. The boundaries between asset management, capacity planning, alarm correlation, and IT-system integration are unique to data centers.
3. Eight modules is the universal checklist // 八個模組是通用清單 #
Asset, Capacity, Environment, Power, Efficiency, Workflow, Alarm, Reporting. No single vendor is strongest across all eight; procurement is about matching strengths to facility profile.
Sensor (Modbus, SNMP, BACnet, OPC-UA), Data (time-series DB, CMDB, event log, data lake), Application (dashboards, capacity planning, workflow, AI optimization). The layered separation is mandatory at the data volumes involved.
5. AI-driven cooling has crossed from research to standard // AI 驅動冷卻已從研究跨到標準 #
Huawei iCooling and Google DeepMind cooling control reduce cooling energy by 8% to 40% depending on the baseline. Any new hyperscale or large-colocation procurement specification today expects an AI optimization layer.
華為 iCooling 與 Google DeepMind 冷卻控制視基線而定降低冷卻能耗 8% 到 40%。任何新的 hyperscale 或大型 Colocation 採購規格今天都預期一層 AI 優化。
6. Predictive maintenance is operationally profitable, not just technically interesting // 預測性維護在運轉上有利可圖,不只是技術上有趣 #
A predictive-maintenance platform deployed across 500 UPS modules pays back in roughly one year. Three-year ROI sits around 225%. The math works for any facility above a few hundred cabinets.
部署在 500 個 UPS 模組上的預測性維護平台約一年回本。三年 ROI 約 225%。對任何幾百櫃以上的機房,這個數學都成立。
7. The L1–L5 autonomy framing makes the trajectory visible // L1–L5 自動駕駛框架讓軌跡可見 #
Most operating facilities sit at L0–L1. Leading hyperscalers sit at L2–L3. The gap is widening because hyperscalers have both the data volume and the engineering capacity to keep moving forward.
Schneider, Sunbird, Nlyte, Huawei, Vertiv, plus cloud-native challengers and an open-source option. No dominant vendor across the eight modules. The fragmentation is itself a meaningful signal about the maturity of the category — it remains in the consolidation phase rather than the post-consolidation phase.
The ninth article in this series goes deeper into the operational discipline that DCIM and AI operations enable: fault analysis (root cause analysis, RCA) and predictive maintenance as a paired practice. Uptime Institute research has consistently shown that roughly 62% of unplanned data center outages are caused by human operational error rather than equipment failure. The closing of that gap — using structured RCA, fault scenario libraries, and predictive maintenance models that learn from every incident — is the single biggest operational improvement opportunity the industry currently has. The next article walks through the methodology, the modern tooling, and several worked case studies of how leading operators are closing the loop.
本系列第 9 篇深入 DCIM 與 AI 運維啟用的運轉學科:故障分析(RCA, Root Cause Analysis,根因分析)與預測性維護作為配對實踐。Uptime Institute 研究一致顯示約 62% 的非計畫性數據中心停機由人為運營錯誤造成,而非設備故障。透過結構化 RCA、故障情境庫、以及從每個事件學習的預測性維護模型來縮小這個差距 —— 是這個產業目前擁有的最大單一運轉改善機會。下一篇走過方法論、現代工具、以及領先業者如何閉環的幾個實際案例。