In thirty years of tracking unplanned data center outages, the Uptime Institute has consistently found one number that surprises nearly everyone outside the industry: roughly 62% of unplanned outages are caused by human operational error, not by equipment failure. The cooling system that ran for ten years without issue did not fail because the chiller broke. It failed because someone, somewhere, configured a control valve wrong during routine maintenance.
That single statistic frames the modern operations discipline. The biggest improvement opportunity in the industry is not better hardware — it is better processes for understanding why things go wrong, and better tools for predicting where they will go wrong next.
Uptime Institute 三十年追蹤非計畫性數據中心停機,一直發現一個讓業外人士驚訝的數字:約 62% 的非計畫性停機由人為運營錯誤造成,而不是設備故障。那套運轉了 10 年沒事的冷卻系統,不是因為冷水機壞了而失效,而是因為例行保養時某人在某處把一個控制閥設定錯了。
Two Paired Practices, One Operational Loop // 兩個配對實踐、一個運轉迴路 #
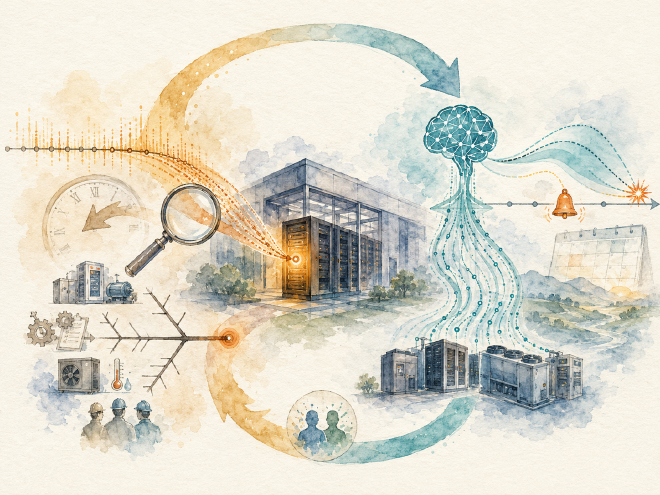
The two disciplines that close this gap are RCA (Root Cause Analysis, 根因分析) — used after a failure to understand what happened — and PdM (Predictive Maintenance, 預測性維護) — used continuously to forecast where the next failure will originate. They share infrastructure, share data, and increasingly share machine-learning models. In a mature operations function, neither stands alone.
This article walks through both, then shows the closed loop that connects them: every RCA conclusion becomes training data for the PdM model, and every PdM prediction becomes a hypothesis to be validated by the next RCA event.
Part 1 — Reading the 62% Number // 第一部分:讀懂這個 62% 的數字 #
The Uptime Institute’s “62%” figure has held remarkably steady over time, even as the industry’s hardware has become more reliable and its monitoring more sophisticated. The breakdown tells the story.
Uptime Institute 的「62%」數字隨時間保持驚人穩定,即使業界的硬體變得更可靠、監控變得更先進。拆解告訴了故事。
Failures vs Incidents: a critical distinction // 故障 vs 事件:關鍵區分 #
The Uptime survey distinguishes between Failures (unplanned outages that caused downtime) and Incidents (events that required intervention but did not necessarily cause downtime). The two distributions look very different:
The asymmetry tells us something important: equipment faults happen more often, but operational errors cause more downtime. A bad capacitor causes alarms; a misconfigured ATS during maintenance takes the whole facility down.
Compounding complexity — Each subsystem (power, cooling, fire, security, network) has reasonable design margin. Compounding interactions between subsystems do not.
The maintenance paradox — The riskiest moments in a facility’s life are scheduled maintenance windows, when operators deliberately bypass automatic protections to work on equipment.
保養悖論 —— 機房生命裡最危險的時刻是排定保養窗口,運維人員故意繞過自動保護來在設備上工作。
Cognitive overload at small data centers — A thousand-sensor facility produces alerts faster than humans can triage them. Important warnings get lost in noise.
The single largest target for operational improvement is not equipment reliability. It is the cognitive and procedural infrastructure that surrounds operators during normal work — runbooks, change windows, alarm prioritization, and post-incident learning.
Part 2 — The Four Layers of Root Cause // 第二部分:根因的四個層次 #
A common analytical mistake during RCA is stopping too early — settling for the first plausible explanation, naming an individual or an obviously faulty component, and closing the ticket. Mature RCA frameworks push past the first one or two layers to identify the systemic factors that allowed the immediate cause to manifest.
“The battery replacement workflow did not include a load test before commissioning.”
L4 — Systemic 系統
“The maintenance management system has no schedule-level visibility for battery age across the fleet, and no policy on load-testing replacement units.”
A well-run organization closes RCA at L3 or L4. An organization that consistently closes at L1 or L2 keeps repeating the same incidents in slightly different forms.
RCA is not about finding who or what to blame. It is about finding what to change so the same thing cannot happen again.
RCA 不是找誰或什麼來咎責。是找出「該改什麼,讓同一件事不能再發生」。
Part 3 — The Five Classical RCA Tools // 第三部分:五個經典 RCA 工具 #
The methodology toolkit for RCA was largely developed in manufacturing — Toyota’s production system, the aerospace industry’s safety culture, the nuclear industry’s incident review processes — and has migrated into IT operations relatively recently. Five tools dominate.
RCA 的方法論工具包大部分在製造業裡發展 —— 豐田生產系統、航太業的安全文化、核能業的事件審查流程 —— 相對較晚才遷移到 IT 運維。五個工具主導。
The simplest tool: ask “why” five times, each time using the previous answer as the new question. Originating from Toyota.
最簡單的工具:問五次「為什麼」,每次用前一個答案當新問題。源自豐田。
A worked example for a hypothetical facility outage:
一個假想機房停電的範例:
Problem: 3rd-floor Hall 2 lost power for 30 minutes.

Why 1: Why did the hall lose power?
       → Because the UPS handoff failed.

Why 2: Why did the UPS handoff fail?
       → Because the static transfer switch (STS) entered fault mode.

Why 3: Why did the STS go into fault mode?
       → Because its control board overheated.

Why 4: Why did the control board overheat?
       → Because the internal cooling fan had stopped.

Why 5: Why was the fan failure not caught before it caused a fault?
       → Because the STS internal fan was not in the PdM monitoring scope.
       ← This is the root cause (L3-L4 systemic).

Corrective action: Add STS internal fan to PdM monitoring scope.
Preventive action: Audit PdM monitoring coverage for ALL critical subsystems.
The trap with the 5-Whys is stopping too early or veering into blaming an individual. A good facilitator keeps the chain focused on system factors, not personal ones.
A category-based brainstorming tool. Instead of following a single chain of reasoning, the Fishbone forces the team to consider multiple parallel causal categories. The classical six categories are 6M:
The Fishbone’s strength is forcing breadth before depth. Its weakness is taking longer than the 5-Whys when the cause is genuinely a single chain.
魚骨圖的強項是強迫先廣再深。它的弱點是當原因真的是單一鏈時,比 5 個為什麼花更久。
FMEA — Failure Mode and Effects Analysis // FMEA:失效模式與影響分析 #
FMEA is a forward-looking, design-time tool. For each component, the team lists every plausible failure mode, scores the Severity (S), Occurrence (O), and Detection (D) of each, computes the Risk Priority Number (RPN = S × O × D), and addresses the highest-RPN items first.
FMEA 是前瞻性、設計階段的工具。對每個元件,團隊列出每個合理的失效模式,給每個失效打嚴重度(S)、發生率(O)、偵測度(D) 分數,計算風險優先級(RPN = S × O × D),先處理 RPN 最高的項目。
A sample FMEA fragment for a UPS subsystem:
UPS 子系統的 FMEA 範例片段:
Failure mode // 失效模式
Effect // 影響
S
O
D
RPN
Mitigation // 緩解
Battery internal resistance rises 電池內阻上升
Switchover trips out during outage 停電時切換跳脫
10
4
6
240
Add internal-resistance monitoring 加內阻監控
Fan failure → overtemp shutdown 風扇故障 → 過溫關機
UPS module drops out UPS 模組退出
9
5
3
135
Add fan-speed sensor 加風扇轉速感測器
Static bypass false trigger 靜態旁路誤觸發
Brief raw-utility exposure to IT IT 短暫暴露於原始市電
7
2
4
56
Bypass interlock + change control 旁路連鎖 + 變更管制
FMEA is widely used in aerospace and automotive but adopted unevenly in the data center industry. Most facilities perform some FMEA-equivalent analysis informally during design review without using the formal scoring framework.
FTA works backward from a defined undesirable outcome (e.g., “facility loses power”) and traces all combinations of upstream events that could produce it, expressed through Boolean logic gates (AND, OR).
The output is a probability — given individual component failure rates, what is the probability of the top-level event? FTA is the standard tool for quantifying reliability in Tier IV designs and for insurance underwriting.
輸出是一個機率 —— 給定個別元件故障率,頂層事件的機率是多少?FTA 是 Tier IV 設計裡量化可靠性、以及保險核保的標準工具。
ETA works forward from an initiating event (e.g., “utility power lost”) and traces each downstream decision node (does UPS take over? does ATS switch? does genset start?) to enumerate possible outcomes with associated probabilities.
ETA 從一個起始事件(例如「失市電」)向前推,追蹤每個下游決策節點(UPS 接管?ATS 切換?發電機啟動?)來列舉可能的結果與相關機率。
FTA and ETA together cover the bidirectional probabilistic analysis needed for SLA modeling and for high-reliability design verification.
Part 4 — Modern RCA: Causal Inference and LLM-Assisted Analysis // 第四部分:現代 RCA —— 因果推論與 LLM 輔助分析 #
The classical tools remain useful but increasingly fall short for one reason: data center operations now produce more telemetry per hour than a human team can read in a week. The interesting questions have shifted from “what caused this?” — answerable from the timeline — to “what caused this that we would not have noticed manually?”
The first AI extension of RCA is not really RCA — it is moving the discovery of fault candidates earlier. Anomaly detection models continuously scan telemetry for patterns that deviate from learned normal behavior, surfacing fault candidates before they cascade into an outage.
RCA 的第一個 AI 延伸實際上不是 RCA —— 而是把故障候選的發現點往前移。異常偵測模型持續掃描遙測尋找偏離已學習正常行為的模式,在它們連鎖造成停機之前浮現故障候選。
Anomaly detection finds the what; causal inference asks the why. Modern tools (Microsoft DoWhy, Uber CausalML, CMU Tetrad) use graphical causal models and counterfactual reasoning to estimate which upstream variable most likely caused a downstream effect — distinguishing actual causation from mere correlation.
The classical example: “Ice cream sales correlate with drowning deaths.” Correlation = strong. Causation = none; both are driven by summer weather. Bayesian causal networks are the formal framework that makes the distinction operationally usable.
Since 2023, large language models have entered the RCA toolkit in three concrete modes:
從 2023 年起,大語言模型以三種具體模式進入 RCA 工具包:
Conversational copilot:
An operator describes the incident; the LLM, given access to telemetry and a knowledge base of past incidents, suggests likely causes and recommended diagnostic steps. The operator remains the decision-maker.
Automated post-incident reports:
After an incident closes, the platform pulls all related telemetry, alarm history, change records, and CCTV footage; the LLM drafts a structured post-mortem report; a human edits and finalizes.
Knowledge-base RAG:
Historical RCA reports are vector-embedded and stored. When a new event begins to look like a previously seen pattern, retrieval-augmented generation surfaces the historical match and the associated remediation playbook.
The operator who can use an LLM-assisted RCA tool well — knows how to write the right prompt, knows how to verify what the model claims — has become a meaningfully more productive incident responder. This is now a standard interview topic for senior data center roles.
Part 5 — The RCA Platform: Seven Functional Modules // 第五部分:RCA 平台 —— 七個功能模組 #
A mature RCA platform is not a single piece of software. It is a stack of seven cooperating modules, each handling one aspect of the analysis-and-learning loop.
成熟的 RCA 平台不是單一軟體。它是七個合作模組的堆疊,每個處理分析與學習迴路的一個面向。
Module
Function // 功能
1. Incident management
Severity classification (P0–P3), timeline tracking, status workflow, on-call routing 嚴重度分類(P0–P3)、時間軸追蹤、狀態流轉、值班路由
2. Timeline reconstruction
Auto-pull telemetry, alarm history, change records, CCTV, access logs for the surrounding window 自動拉取事件前後窗口的遙測、警報歷史、變更紀錄、CCTV、門禁日誌
3. Fault scenario library
Historical incidents stored as embeddings; similarity search for matching past cases 歷史事件以嵌入向量儲存;用相似度搜尋匹配的過去案例
The fault scenario library is arguably the most differentiating module. A platform that has accumulated hundreds of well-documented historical incidents, each with a structured timeline and a vetted root cause, becomes meaningfully better at suggesting matches than a platform without that history. The library compounds over time.
Part 6 — Six Worked Failure Scenarios // 第六部分:六個實際故障情境 #
The clearest way to make the abstract concrete is to walk through example failure timelines. The six below are composites — drawn from public Uptime case studies, vendor post-mortems, and industry forums — illustrating the diversity of modern data center failure modes.
T-30 min  Scheduled UPS 2 maintenance begins
T-25 min  Maintenance bypass engaged on UPS 2
T-20 min  ANOMALY: UPS 1 quietly enters its own bypass (no alarm raised)
T-10 min  Utility voltage flicker
T-5 min   UPS 1's bypass cannot absorb the disturbance
T= 0      All IT loads in Hall 2 drop power for 30 seconds
L2 cause: Both UPS systems were in bypass simultaneously — an architectural prohibition.
L2 原因:兩台 UPS 同時在旁路 —— 架構禁區。
L3 cause: Change workflow did not include a “both paths healthy” interlock check.
L3 原因:變更工單沒包含「兩路徑健康」連鎖檢查。
L4 cause: No automated “single-path operating” warning across the facility.
L4 原因:機房沒有自動化的「單路徑運轉」警告。
Scenario 2 — Cooling failure with ignored early alarm // 情境二:冷卻失效 + 早期警報被忽略 #
T-60 min  Chiller 1 efficiency begins to degrade (early-warning alarm raised)
T-50 min  Alarm acknowledged but not investigated — categorized as routine
T-30 min  Room temperature drift +0.5°C/min becomes noticeable
T-15 min  Five cabinets exceed 32°C
T-5 min   Multiple cabinets exceed 35°C
T= 0      Server BMC thermal-protection triggers automatic shutdown
The root cause was not the chiller. It was the alarm prioritization scheme that allowed an early-warning alarm to be categorized as “routine” and acknowledged without investigation.
根因不是冷水機。是警報優先級設計允許一個「早期警告」被歸類為「例行」並被認可而不調查。
Scenario 3 — Fire system + access control linkage failure // 情境三:消防 + 門禁聯動失敗 #
T= 0      Electrical short in a cabinet ignites a small fire
T+30 s    Cabinet-level fire suppression discharges (partial containment)
T+60 s    Room-level VESDA detects smoke
T+90 s    Room-level Novec gas suppression discharges
T+90 s    BUG: HVAC does NOT shut down → Novec dispersed before reaching concentration
T+150 s   Fire spreads to adjacent cabinet
T+200 s   BUG: Access doors do NOT unlock automatically — maintenance staff trapped
T+5 min   Sprinklers activate; all equipment destroyed
T+10 min  Fire department arrives
This is a classic linkage-failure case. The individual subsystems worked. The choreography between them did not. Annual full-system linkage testing would have caught both bugs before they mattered.
Scenario 4 — Unauthorized intrusion via tailgating // 情境四:透過尾隨的未授權入侵 #
T= 0      Departed employee enters lobby with still-active badge (HR system not synced)
T+5 min   Tailgates a current employee into the data hall
T+30 min  Lingers near a specific cabinet
T+45 min  Removes a network cable and replaces it with a packet-sniffing device
T+1 hr    Departs
T+1 day   IT notices unusual network behavior
T+1 week  Security team reviews CCTV and identifies the breach
Three independent failures: HR-to-access-control synchronization gap; no anti-tailgating (mantrap) at the data hall entry; no real-time CCTV behavior analytics. Any one of the three would have prevented the breach.
T-7 days   PdM alarm: cell 12 temperature drifting upward (alarm ignored as noise)
T-1 day    PdM alarm: cell 12 internal resistance anomaly (alarm ignored)
T-2 hr     Cell 12 enters thermal runaway
T-30 min   Smoke detection (short-circuit + electrolyte vapor)
T= 0       Fire and rapid expansion
T+2 min    Building evacuation
T+30 min   Fire department arrives — lithium fires are notoriously hard to extinguish
T+24 hr    Recovery operations begin
This is the modern failure mode that the lithium transition has introduced to data centers. The PdM signal was there days in advance and was missed twice. A PdM platform integration without escalation policy is worse than no PdM platform at all — it provides false reassurance.
T= 0      Large DDoS attack on a customer's site
T+5 min   CDN absorbs 70%; 30% reaches origin servers
T+10 min  Origin servers ramp to 100% CPU utilization
T+15 min  Facility electricity draw rises 40%
T+20 min  UPS enters overload warning state
T+30 min  Cooling system reaches design ceiling
T+40 min  Room temperature begins to climb
T+50 min  Some cabinets initiate automatic frequency throttling
T+60 min  DDoS attack ends
T+90 min  Facility stabilizes
This scenario does not look like a facility incident; it looks like a customer’s IT incident. But the chain of events crosses the IT/facility boundary, and a strict separation between IT operations and facility operations would have left both teams blind to what was happening on the other side.
這個情境看起來不像機房事件;看起來像客戶的 IT 事件。但事件鏈跨越 IT/設施邊界,IT 運維與設施運維的嚴格分離會讓兩個團隊對另一邊發生的事情都瞎掉。
The architectural lesson: facility DCIM and IT operations monitoring need a shared dashboard layer for cross-boundary events.
架構教訓:機房 DCIM 與 IT 運維監控需要為跨邊界事件共用儀表板層。
Part 7 — Post-mortem Culture: Blameless and SLO-Based // 第七部分:事後文化 —— 無責與 SLO 基礎 #
Two cultural practices have done more than any technology to improve modern operations: blameless post-mortems and SLO/Error-Budget management. Both come from Google’s Site Reliability Engineering (SRE) tradition and have spread through the wider industry over the last decade.
兩個文化實踐對改善現代運維比任何技術做得更多:無責事後檢討與 SLO/錯誤預算管理。兩者都來自 Google 的網站可靠性工程(SRE)傳統,過去十年透過整個產業擴散。
The core principle: assume everyone involved made the best decision they could with the information they had at the time. Find the systemic factors that allowed the situation to develop, not the individual to assign blame to.
What went wrong — Systemic factors to change (NOT individuals)
做錯的事 —— 要改變的系統性因素(不是個人)
Action items — Owner, due date, change description
行動項目 —— 負責人、截止日、變更描述
Lessons learned — Adds to the fault scenario library
學到的教訓 —— 加入故障情境庫
The cultural shift that enables blameless analysis is harder than the template. It requires senior leadership to demonstrate, repeatedly, that they will not punish operators for honest mistakes — because the alternative, fear-driven incident reporting, distorts the data more than missing reports do.
The second SRE-derived practice is treating reliability as a quantitative budget rather than a binary target.
第二個來自 SRE 的實踐是把可靠性當量化預算,而不是二元目標。
Term
Definition // 定義
SLI (Service Level Indicator)
A measurable metric (e.g., monthly uptime percentage) 可量測指標(如月度可用率)
SLO (Service Level Objective)
An internal target (e.g., 99.95% monthly uptime) 內部目標(如月度 99.95% 可用率)
SLA (Service Level Agreement)
A contractual commitment to customers (e.g., 99.9%, with penalties below) 對客戶的契約承諾(如 99.9%,以下有罰則)
Error Budget
The allowed downtime under the SLO (e.g., 99.95% = 4.38 hr/year) SLO 下允許的停機(如 99.95% = 4.38 hr/年)
The clever twist is how the Error Budget is used: when it is mostly unspent, the team is allowed (even encouraged) to make changes, run experiments, push new features. When it is mostly spent, change freezes go into effect until reliability returns to target.
The Error Budget concept replaces subjective arguments about “are we being too cautious?” or “are we taking too many risks?” with a measured number. The argument shifts from rhetoric to math.
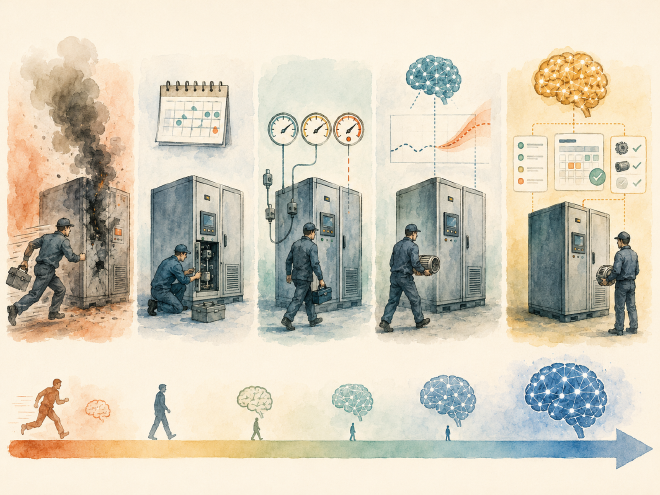
Part 8 — Maintenance: The Five Maturity Levels // 第八部分:維護的五個成熟度等級 #
If RCA looks backward at what failed, the discipline that looks forward — and tries to prevent failure entirely — is maintenance. Modern frameworks organize maintenance into five maturity levels.
The transformer Dissolved Gas Analysis (DGA) use case is worth highlighting because it predates modern ML and shows how interpretable PdM has been for decades. The mix of dissolved gases in transformer oil — hydrogen, methane, acetylene, ethylene, ethane — varies with fault type. The classical Duval Triangle method classifies the fault from the gas ratios. Modern ML overlays improve sensitivity but build on the same physical foundation.
The time-series database — historical telemetry, same data for backward analysis and forward prediction
時序資料庫 —— 歷史遙測,向後分析與向前預測用同一份資料
The fault scenario library — each RCA conclusion becomes a labeled training example for the PdM model
故障情境庫 —— 每個 RCA 結論變成 PdM 模型的標註訓練範例
When an organization builds these as separate systems for the two functions, the loop does not close. When they are built as one shared substrate, every incident makes the next prediction more accurate, and every prediction creates a hypothesis the next incident either validates or refutes.
The closed loop is the difference between operations that improve year over year and operations that repeat the same incidents in slightly different forms. The technology is now widely available. What separates the leaders from the followers is the discipline to use it consistently.
1. 62% of unplanned outages come from human operations // 62% 的非計畫性停機來自人為運營 #
The Uptime Institute number has been stable for thirty years. Equipment reliability has improved; operational complexity has compounded. The single largest improvement target is procedural, not technical.
Uptime Institute 的數字三十年來保持穩定。設備可靠性改善了;運轉複雜度複合了。最大的改善目標是流程性的,不是技術性的。
2. RCA must reach L3 or L4 to be useful // RCA 必須抵達 L3 或 L4 才有用 #
Stopping at “the UPS failed” closes a ticket but learns nothing. Reaching “no policy on load-testing replacement units” produces a systemic change that prevents recurrence.
3. The five classical RCA tools each have a niche // 五個經典 RCA 工具各有其位 #
5 Whys for speed, Fishbone for breadth, FMEA for design-time prevention, FTA for SLA quantification, ETA for scenario planning. A mature operations function uses all five at different moments.
4. LLM-assisted RCA has crossed from novelty to standard // LLM 輔助 RCA 已從新奇跨到標準 #
Conversational copilots, automated post-mortem drafting, knowledge-base RAG. The operator who knows how to use these tools well is meaningfully more productive than one who does not.
5. Blameless post-mortems and Error Budgets came from SRE // 無責事後檢討與錯誤預算來自 SRE #
Both replace fear-driven or argument-driven dynamics with measurement-driven ones. Both spread from Google through the wider industry over the last decade.
兩者都把恐懼驅動或爭論驅動的動態替換成量測驅動的。兩者都在過去十年從 Google 擴散到更廣的產業。
Reactive → preventive → condition-based → predictive → prescriptive. Most operating facilities sit between L2 and L3. Leading operators are at L4. L5 is experimental.
7. PdM is operationally profitable above a few hundred cabinets // PdM 在幾百櫃以上運轉上有利可圖 #
A $300K platform CAPEX with $100K/year OPEX saves $325K/year on a 500-UPS-module facility. One-year payback, ~225% three-year ROI. The economics work cleanly above a certain scale.
8. The closed loop is what separates leaders from followers // 閉環把領先者跟追隨者分開 #
RCA conclusions become PdM training data; PdM predictions become RCA hypotheses. Built as one shared substrate, the loop compounds. Built as separate systems, it does not close.
The tenth article in this series covers the smaller L1 subsystems that we have referenced repeatedly but never given dedicated treatment: fire suppression (including the supply chain shock from 3M’s exit from PFAS chemistry, which is removing Novec 1230 from the market), cabinet and rack standards (19-inch EIA-310-D versus the OCP 21-inch Open Rack versus the AI-driven NVL72 paradigm), structured cabling (the 400G/800G optical surge driven by AI clusters), physical security (the geopolitical issue around Hikvision and Dahua restrictions in Western markets), and lightning protection and grounding (the IEC 62305 three-tier SPD model and why 33% of facility faults still trace to electrical and grounding issues). None of these subsystems is large as a percentage of CAPEX, but each contains failure modes that can take down an entire facility.
本系列第 10 篇涵蓋我們反覆提到但從未專門處理的較小 L1 子系統:消防(含 3M 退出 PFAS 化學品的供應鏈衝擊,正把 Novec 1230 從市場上移除)、機櫃與機架標準(19 吋 EIA-310-D vs. OCP 21 吋 Open Rack vs. AI 驅動的 NVL72 範式)、結構化佈線(AI 集群驅動的 400G/800G 光模組暴增)、實體安防(Hikvision 與 Dahua 在西方市場受限的地緣政治議題)、防雷與接地(IEC 62305 三級 SPD 模型,以及為什麼 33% 的機房故障仍可追溯到電氣與接地問題)。沒有一個子系統佔 CAPEX 比例很大,但每一個都包含可以拖垮整座機房的故障模式。