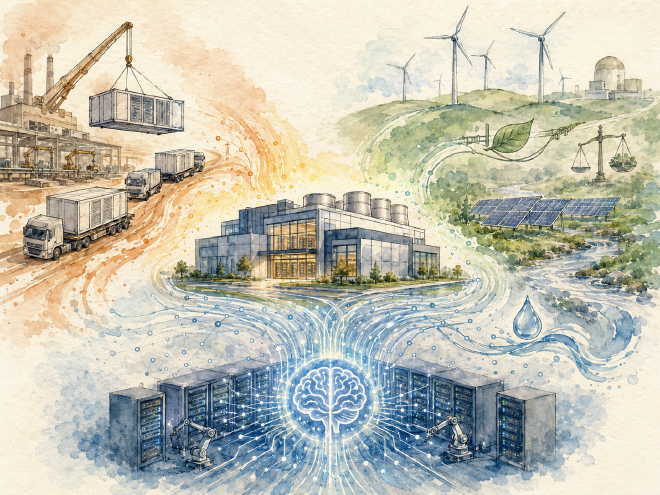
In 2020, building a data center took 27 months, ran almost entirely under human supervision, and emitted roughly 100,000 tons of CO₂ over its 10-year operating life. In 2025, leading operators are completing data centers in 6 months, signing 100% renewable power contracts before breaking ground, and running AI-driven optimization systems that make thousands of decisions per day without human input. Three forces have driven the change — and a fourth, the geopolitical bifurcation of the equipment vendor ecosystem, sits underneath all three. This article maps the four together and points at what the late 2020s look like.
Why the Industry Is Reshaping Now // 為什麼這個產業現在正在重塑 #
For most of the data center industry’s history, change was incremental. Power systems got slightly more efficient. Cooling architectures evolved through familiar variations. Building methods looked the same in 2010 as in 1990. The defining feature of the past five years has been the simultaneous collision of three accelerating forces, plus a geopolitical realignment that affects all three.
Prefabrication — Compressing 27-month builds to 6 months by manufacturing the data center as a product, not constructing it as a building.
預製化 —— 把 27 個月建設壓縮到 6 個月,方法是把數據中心當產品製造,而不是當建物建造。
Sustainability — Carbon caps, water restrictions, ESG regulations, and renewable energy mandates moving from soft preferences to hard constraints.
永續 —— 碳上限、水資源限制、ESG 法規、再生能源強制要求從軟性偏好走向硬性約束。
Autonomous operations — AI-driven optimization and predictive maintenance moving from research curiosity to standard procurement.
自動駕駛運轉 —— AI 驅動優化與預測性維護從研究稀奇變成標準採購。
And underneath all three // 而三者之下:
The geopolitical bifurcation — The equipment vendor ecosystem has split into two near-incompatible tracks (Western and Chinese), and Taiwan sits at the bridge between them.
This article works through each force, then closes with a comparative look at the major equipment vendor strategies and a 2030 outlook for the combined effect.
這篇文章走過每股力量,然後以主要設備廠商戰略的比較分析與 2030 年合併效應展望結束。
Part 1 — Prefabrication: Treating the Building as a Product // 第一部分:預製化 —— 把建物當產品 #
The conceptual shift behind the prefabricated modular data center (PMDC) is straightforward: a data center is no longer a building that gets constructed; it is a product that gets assembled.
The shift mirrors what happened in automotive manufacturing a century ago and in consumer electronics fifty years ago. The traditional approach — pour concrete on site, install equipment one piece at a time, integrate everything in the field — is structurally similar to building a car in a horse-drawn cart workshop. The prefabricated approach — manufacture standardized modules in a factory, ship them complete, plug them together on site — is structurally similar to Henry Ford’s assembly line.
這個轉變鏡像了一百年前汽車製造與五十年前消費電子發生的事。傳統方法 —— 現場澆混凝土、一件件安裝設備、現場整合 —— 結構上類似在馬車作坊裡造車。預製化方法 —— 在工廠製造標準化模組、整套出貨、現場插接 —— 結構上類似 Henry Ford 的裝配線。
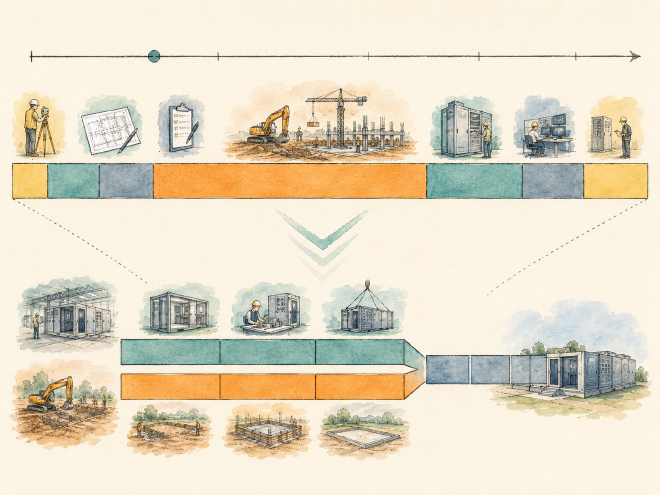
Traditional construction is sequential: site preparation finishes, then foundation, then structure, then MEP, then equipment, then commissioning. Each phase waits for the previous one to complete.
PMDC construction is parallel: while the site is being prepared, modules are being manufactured in a factory. Factory acceptance testing runs concurrently. Site civil work and module fabrication finish around the same time. Module shipping and on-site installation become a coordination problem, not a sequential dependency.
Standardized module design — No bespoke engineering per project; design time drops 50–80%
標準化模組設計 —— 每專案無客製工程;設計時間降 50–80%
Parallel factory production — Equipment fabrication runs alongside site civil work, not after it
平行工廠生產 —— 設備製造跟場地土建並行進行,不是在後
Simplified civil work — PMDC sites often use lightweight steel structures and reinforced slabs rather than full traditional buildings
簡化土建 —— PMDC 場地常用輕量鋼結構與強化樓板,而不是完整傳統建物
FAT before shipping — Modules arrive 80% commissioned, with only integration testing remaining
出貨前 FAT —— 模組以 80% 調試完抵達,只剩整合測試
Shortened final commissioning — Most functional tests are completed in the factory; site IST is much faster
縮短最終調試 —— 多數功能測試在工廠完成;現場 IST 快得多
The aggregate result: a 27-month traditional build compressed to 6 to 11 months as a PMDC build. The compression has been validated at scale by deployments from Huawei, Vertiv, Schneider, and the Chinese hyperscalers.
Time-to-market matters more in AI infrastructure than in any previous data center era. A 12-month build versus a 24-month build is not just a 12-month difference — it is the difference between being able to deploy this generation of NVIDIA GPUs versus the next generation. The economic case for PMDC is now structurally aligned with the hardware refresh cycle.
TTM 在 AI 基礎設施上比過去任何數據中心時代都重要。12 個月建設 vs 24 個月建設不只是 12 個月差距 —— 是「能部署這代 NVIDIA GPU」對「能部署下一代」的差別。PMDC 的經濟學論點現在結構上跟硬體汰換週期對齊。
Part 2 — The PMDC Vendor Landscape // 第二部分:PMDC 廠商版圖 #
The PMDC market is younger than the traditional data center equipment market, less consolidated, and includes both established equipment giants and new specialists.
PMDC 市場比傳統數據中心設備市場年輕、較不整合、包括既有設備巨頭與新專業廠商。
Vendor
HQ
Product line // 產品線
Huawei
China
FusionModule 2000 (310 kW) / 800 (40 kW) / 500 (3 kW); FusionDC 1000 A / B / C
The most aggressive PMDC adopters are not buying from vendors at all. They are designing modular data centers in-house and contracting Taiwanese ODMs to manufacture them.
最積極的 PMDC 採用者根本沒在跟廠商買。他們自己內部設計模組化數據中心、簽台灣 ODM 製造。
Meta — Open Compute Project (OCP) modular designs, manufactured primarily by Quanta and Wiwynn // Open Compute Project(OCP)模組化設計,主要由廣達與緯穎製造
Microsoft — Custom modular designs for both Azure and the Stargate AI infrastructure // Azure 與 Stargate AI 基礎設施的客製模組化設計
Google — Internal modular designs, with selective ODM contracting // 內部模組化設計,加上選擇性 ODM 簽約
AWS — Outposts (commercial) plus internal modular for new region buildouts // Outposts(商用)加新 region 擴建用的內部模組化
Frost & Sullivan reported Huawei holding #1 global market share in prefabricated modular data centers at roughly 43.5% of the global market in 2021, and #1 global market share in modular UPS at roughly 19.0%. The numbers are notable because they predate the most acute US restrictions on Chinese tech.
In the years since, the practical reality has been a market split: Huawei holds dominant share in China, the Belt and Road region, the Middle East, and Africa, while Vertiv and Schneider hold dominant share in North America, Europe, Japan, Australia, and the rest of the OECD. We will return to this geopolitical split later in the article.
Part 3 — Sustainability: The Regulatory Wave // 第三部分:永續 —— 法規浪潮 #
For most of data center history, sustainability was a marketing preference. ESG reporting was voluntary. Carbon was unpriced. Water was assumed abundant. Renewable energy was an aspiration, not a requirement. All of that has changed in the past five years, and the regulatory pressure continues to tighten.
Mandatory ESG reporting with third-party assurance 強制 ESG 報告,第三方保證
CBAM (Carbon Border Adjustment Mechanism)
EU
2026 full implementation
Carbon tariff on imported goods including data center equipment 對進口商品(含數據中心設備)課碳關稅
EU Energy Efficiency Directive (revised)
EU
2024
Mandatory PUE reporting for facilities >500 kW; targets for 2030 500 kW 以上設施強制 PUE 報告;2030 目標
Taiwan Carbon Fee
Taiwan
2025
NT$300/ton CO₂ initial, projected to rise 初期 NT$300/噸 CO₂,預計上升
China National Carbon Market
China
Operational since 2021
Cap-and-trade for power generation; expansion planned 發電業限額交易;計畫擴展
Singapore DC Moratorium
Singapore
2019–2022 (then lifted with strict PUE caps)
Pause on new DC permits; relaunch with PUE <1.3 requirement 暫停新 DC 許可;以 PUE < 1.3 要求重啟
Netherlands DC Permit Tightening
Netherlands
2022 onward
Restrictions on new builds in major regions due to grid stress 因電網壓力對主要區域新建限制
Ireland Grid Connection Restrictions
Ireland
2022 onward
EirGrid effectively pausing new DC grid connections in Dublin region EirGrid 實質暫停都柏林區域新 DC 電網接入
What CBAM actually does to data centers // CBAM 實際上對數據中心做什麼 #
The Carbon Border Adjustment Mechanism is worth understanding in detail because it operates indirectly but pervasively. CBAM puts a carbon tariff on imports of carbon-intensive goods into the EU. The initial product categories include cement, steel, aluminum, fertilizers, electricity, and hydrogen.
Steel and cement imported for construction are tariffed at the carbon equivalent
建設用的進口鋼與水泥按碳當量課關稅
Aluminum used in cooling systems and busbars is tariffed
冷卻系統與母線用的鋁課關稅
Electricity imported across EU borders is tariffed if it does not meet renewable thresholds
跨歐盟邊境進口的電力若未達再生能源門檻則課關稅
Future expansion to data center equipment categories is being discussed
未來擴展到數據中心設備類別正在討論
The practical effect is that low-carbon supply chains become commercially advantaged within the EU market. Equipment manufactured in jurisdictions with high-carbon power generation faces a tariff disadvantage when shipped to EU customers.
CBAM is the first regulatory mechanism that translates the carbon intensity of a supply chain into direct commercial cost. The data center industry has been preparing for it since 2022, primarily by pushing suppliers to verify and reduce their Scope 3 emissions.
Part 4 — Water, Carbon, and Waste Heat // 第四部分:水、碳、廢熱 #
Beyond the regulatory wave, three operational sustainability topics have moved from peripheral to central in the past five years.
法規浪潮之外,三個運轉永續主題在過去五年從邊緣移到中心。
Water restrictions and the PUE-WUE trade-off // 水限制與 PUE-WUE 權衡 #
As covered in article 5, evaporative cooling — the technology that allows dry-climate sites to reach PUE 1.1 — also drives water consumption to roughly 1.5–2.5 liters per kWh of IT load. A 1,000-cabinet facility consumes roughly 63,000 tons of water per year under this regime.
如第 5 篇所述,蒸發冷卻 —— 讓乾燥氣候場址達 PUE 1.1 的技術 —— 也把水消耗推到大約每 kWh IT 負載 1.5–2.5 公升。1,000 機櫃機房在這個模式下每年消耗約 63,000 噸水。
Water-stressed regions are now imposing WUE caps that effectively prohibit evaporative cooling:
缺水區域現在強加 WUE 上限,實質上禁止蒸發冷卻:
United Arab Emirates(阿聯酋) — New data center permits subject to WUE limits // 新數據中心許可受 WUE 限制
Singapore(新加坡) — Lifted DC moratorium tied to combined PUE/WUE thresholds // 解除 DC 暫停跟合併的 PUE/WUE 門檻綁定
Central and southern Taiwan(台灣中南部) — Public scrutiny tied to industrial water rationing during recurring droughts // 公眾審視跟反覆乾旱期間的工業限水綁定
Parts of Spain(西班牙部分地區) — Water restrictions affecting major IDC operators in Madrid region // 水限制影響馬德里區域的主要 IDC 業者
The structural consequence: dry-climate operators that built their PUE strategy around evaporative cooling are now being forced to rethink. Direct liquid cooling (which uses far less water) and air-cooled chilled water (which uses almost none) are gaining favor in these markets.
結構性後果:在乾燥氣候建立 PUE 策略圍繞蒸發冷卻的營運者,現在被迫重新思考。直接液冷(用水遠少)與氣冷冷凍水(幾乎不用水)在這些市場獲得青睞。
Carbon costs and the renewable PPA wave // 碳成本與再生能源 PPA 浪潮 #
The combination of carbon pricing and ESG reporting requirements has made renewable energy procurement a strategic priority for major operators. The dominant procurement mechanism is the Power Purchase Agreement (PPA) — a long-term contract directly with a renewable energy generator, bypassing the grid retail market.
Major hyperscaler PPA portfolios (cumulative, as of 2024–2025):
主要超大規模業者 PPA 組合(累計,2024–2025 為止):
Amazon — Over 33 GW of renewable PPAs signed globally (the largest corporate buyer of clean energy in the world) // 全球簽超過 33 GW 再生能源 PPA(世界最大的企業潔淨能源買家)
Microsoft — Over 13 GW including solar, wind, and emerging nuclear (Three Mile Island restart) // 超過 13 GW,含太陽能、風力、與新興核能(三浬島復役)
Meta — Over 15 GW primarily solar and wind // 超過 15 GW,主要太陽能與風力
Google — Over 12 GW plus pioneering deals with small modular reactor (SMR) developer Kairos Power // 超過 12 GW,加上跟小型模組化反應爐(SMR)開發商 Kairos Power 的開創性交易
For AI training workloads — which require 24/7 baseload power, often hundreds of megawatts at a single site, often in regions where solar and wind alone cannot reliably provide that baseload — the hyperscalers have started signing nuclear power contracts that would have been politically impossible a decade ago.
對 AI 訓練工作負載 —— 它需要24/7 基載電力、單一場址常數百 MW、常在太陽能與風力單獨無法可靠提供那個基載的區域 —— 超大規模業者已經開始簽十年前在政治上不可能的核電合約。
Microsoft + Constellation Energy — 20-year PPA reviving the Three Mile Island Unit 1 nuclear plant, dedicated to Microsoft’s AI workloads // 20 年 PPA 復活三浬島 1 號核電廠,專用於 Microsoft 的 AI 工作負載
Amazon + Talen Energy — Direct grid connection at the Susquehanna nuclear plant for AWS data center // 在 Susquehanna 核電廠直接電網接入,給 AWS 數據中心
Google + Kairos Power — Investment in small modular reactor development, with planned 500 MW deployment by 2030 // 投資小型模組化反應爐開發,計畫 2030 年部署 500 MW
Oracle (Larry Ellison statement) — Three small modular reactors planned to power AI data center // 計畫三座小型模組化反應爐供電 AI 數據中心
This is the most striking shift in the industry’s power-sourcing strategy in fifty years. It reflects a coldly economic calculation: AI infrastructure needs power that renewables alone cannot reliably provide; gas turbines come with carbon liability; nuclear is the remaining option that meets both reliability and carbon constraints.
Waste heat recovery — emerging but real // 廢熱回收 —— 新興但真實 #
The heat that data centers reject to the atmosphere has been historically wasted. In cold climates, a growing number of facilities are recovering that heat for district heating, hot water, and industrial process heat.
Stockholm Data Parks — Stockholm initiative connecting data center waste heat to the city district heating network; supplied to thousands of residential apartments // 斯德哥爾摩主動連結數據中心廢熱到城市區域供熱網路;供應數千戶住宅
Equinix HE5 Helsinki — Heat recovery providing district heating to roughly 11,000 households // 熱回收提供區域供熱給約 11,000 戶
Microsoft Helsinki region — Planned heat recovery for district heating // 計畫熱回收做區域供熱
Waste heat recovery economics depend on the existence of a district heating network nearby. In countries without district heating (most of the US, most of Asia outside northern China), the technology is structurally constrained. In Northern Europe, where district heating is widespread, it is becoming routine.
Article 8 in this series introduced the five-level framework for autonomous data center operations. Most facilities sit at L0–L1. Leading hyperscalers sit at L2–L3. The gap is widening because the leading hyperscalers have both the telemetry volume to train sophisticated models and the engineering capacity to deploy them.
A level-4 facility runs continuous AI optimization across power, cooling, and capacity allocation simultaneously, with human operators in a supervisory role rather than an active-control role. Concrete examples of what this means in practice:
L4 機房在電力、冷卻、容量分配上同時跑連續 AI 優化,人類運維人員處在監督角色而不是主動控制角色。實務上這意味著什麼的具體例子:
Cooling setpoints adjusted every few minutes based on predicted IT load 30 minutes out
冷卻設定點每幾分鐘調整,基於 30 分鐘外預測的 IT 負載
Chiller staging decisions made by the system, not by an operator following a schedule
冷水機分階決策由系統做,不是運維人員照排程
PdM models triggering work orders directly for maintenance crews, with operator approval rather than operator authoring
PdM 模型直接觸發工單給維護人員,運維人員核准而非撰寫
Capacity allocation across racks rebalanced by the system to match workload patterns
跨機櫃的容量分配由系統重新平衡以符合工作負載模式
Failover decisions executed automatically within pre-authorized envelopes
故障切換決策自動執行在預授權範圍內
Post-mortem reports drafted by LLM from raw telemetry, with operator editing rather than authoring
事後報告由 LLM 草擬,從原始遙測,運維人員編輯而非撰寫
The transition from L3 to L4 is fundamentally about trust delegation — the organization deciding which decisions the AI system is authorized to execute without prior human approval, and the AI system earning that trust through demonstrated reliability over time.
L3 到 L4 的轉變根本上是關於信任委派 —— 組織決定 AI 系統被授權執行哪些不需要事先人類核准的決策、AI 系統透過長期展現的可靠性贏得那個信任。
Level 5 — full autonomy without human oversight — is not yet realized at any production facility, and the timeline for getting there remains uncertain. Three barriers are persistent:
Novel-event handling — AI systems trained on past data handle known scenarios well but novel events (a chemistry change at a battery supplier, a regulatory shift in a region) require human judgment
新事件處理 —— 用過去資料訓練的 AI 系統處理已知情境好,但新事件(電池供應商化學變更、區域法規轉變)需要人類判斷
Regulatory accountability — Insurance, regulatory bodies, and corporate governance still require a named human to be accountable for facility decisions
法規問責 —— 保險、法規機構、企業治理仍要求一個具名人類對機房決策負責
Trust dynamics — Even when AI systems demonstrably outperform human operators on average, the failure modes can be unfamiliar and concerning, and full delegation is socially slow to develop
信任動態 —— 即使 AI 系統平均上明顯優於人類運維人員,故障模式可以是不熟悉與令人擔心的,完全委派在社會上發展緩慢
The realistic 2030 expectation is most hyperscaler facilities at L3, leading hyperscalers at L4, L5 still aspirational.
現實的 2030 預期是多數超大規模業者機房在 L3、領先超大規模業者在 L4、L5 仍是抱負。
Part 6 — Vendor Strategy Comparison // 第六部分:廠商戰略比較 #
The three forces above — prefabrication, sustainability, autonomy — are being played out competitively by the major equipment vendors. Each vendor has chosen a strategic posture that reveals what they believe about where the industry is going.
Schneider plays an ecosystem strategy — its EcoStruxure brand spans data center, building, industry, and grid. The competitive moat is not any single product but the integration across the portfolio. This is the same playbook Microsoft uses in enterprise software.
Schneider 玩生態系統戰略 —— 它的 EcoStruxure 品牌跨數據中心、建築、工業、電網。競爭護城河不是任何單一產品,而是組合間的整合。這是 Microsoft 在企業軟體上用的同一手冊。
Vertiv plays a focus strategy — equipment depth, service network, deliberate avoidance of becoming a software ecosystem. This is the playbook a focused industrial company uses to defend share against a larger ecosystem player.
Huawei plays a vertical integration strategy — equipment, software, service, and AI optimization all under one roof. The competitive moat is the deep integration between subsystems that less-integrated vendors cannot match. The geopolitical restriction is the cost of this strategy in Western markets.
No single vendor strategy is obviously right. The three approaches each have visible champions, visible customers, and visible commercial success. The data center buyer’s choice between them increasingly reflects their own organizational structure — ecosystem buyers tend to choose Schneider, depth-focused buyers tend to choose Vertiv, vertically-integrated buyers tend to choose Huawei (where geopolitically possible).
The four largest hyperscalers — Amazon, Microsoft, Google, Meta — increasingly buy nothing from any of these vendors at the architecture level. They design custom data centers, contract Taiwanese ODMs (Quanta, Wiwynn, Foxconn, Inventec, Wistron) for white-box server manufacturing, contract directly with electrical and mechanical equipment makers, and run their own DCIM and AI optimization stacks.
四大超大規模業者 —— Amazon、Microsoft、Google、Meta —— 越來越在架構層級上不向任何這些廠商買。他們設計客製數據中心、簽台灣 ODM(廣達、緯穎、鴻海、英業達、緯創)做白牌伺服器製造、直接跟電氣與機械設備製造商簽約、跑自己的 DCIM 與 AI 優化堆疊。
The traditional vendors compete for the next tier down — large IDCs, large EDCs, mid-size colocation operators — where the buyer does not have the scale to justify building everything in-house.
Part 7 — The Geopolitical Bifurcation // 第七部分:地緣政治分裂 #
The Western-versus-Chinese vendor split is real, has accelerated since 2019, and now constitutes one of the structural features of the global data center industry.
The Western track excludes Huawei (US Entity List 2019, expanded multiple times), Hikvision and Dahua (NDAA 2019 Section 889 for cameras), ZTE (partial restrictions), and Chinese silicon broadly (CHIPS Act and BIS export controls).
The Chinese track increasingly excludes US-designed advanced silicon (BIS rules block NVIDIA H100/H200/B200 from China; only de-rated H20 variant currently allowed), parts of the US software ecosystem, and has reciprocal restrictions on Cisco, Western firewall vendors, and several Western chip categories.
Taiwanese ODMs and TSMC operate on both tracks. They build servers for AWS and Inspur, supply chips to NVIDIA and (within export-control limits) Huawei, and ship power supplies to both ecosystems. This bridging role has become commercially valuable and geopolitically delicate in equal measure.
Whether the Taiwanese bridging role remains viable through the next decade is one of the single largest open questions in global technology supply-chain planning. The current answer — “yes, with growing friction” — is unlikely to hold unchanged through 2030.
The most-cited forward estimates from McKinsey, Goldman Sachs, and S&P Global, triangulated:
McKinsey、Goldman Sachs、S&P Global 最常被引用的前向估計,三角驗證:
Global data center capacity in 2030: 171–219 GW (up from ~75 GW in 2024)
2030 全球數據中心容量:171–219 GW(從 2024 年的約 75 GW 上升)
Cumulative CapEx 2024–2030: ~$6.7 trillion
2024–2030 累計 CapEx:約 $6.7 兆
AI training share of new build by 2030: 60%+
2030 年 AI 訓練佔新建比例:60%+
Liquid cooling share of new build by 2030: 50%+ overall, 80%+ for AI clusters
2030 年液冷佔新建比例:整體 50%+、AI 集群 80%+
Hyperscaler renewable PPA volume by 2030: well over 200 GW signed
2030 年超大規模業者再生能源 PPA 簽訂量:遠超 200 GW
What the qualitative landscape looks like // 質性版圖看起來怎樣 #
By 2030, the typical narrative for what new data centers look like will have shifted in several dimensions:
到 2030 年,新數據中心長什麼樣的典型敘事在幾個維度上會轉變:
Build time is no longer the bottleneck. PMDC has compressed it. Most new builds complete in 8 to 12 months. The bottleneck has moved upstream to grid connection and chip allocation.
Air-cooled is the exception, not the rule. Liquid cooling is mainstream for any cabinet above 20 kW. AI clusters running at 100+ kW per cabinet are common.
氣冷是例外,不是規則。 液冷對任何 20 kW 以上機櫃是主流。100+ kW/櫃跑的 AI 集群普遍。
Renewable power is the default. 100% renewable PPAs cover most hyperscaler load. Nuclear (including SMRs) provides the baseload share. Gas turbines remain for emergency backup only.
Carbon is priced into every decision. CBAM-equivalent mechanisms have spread beyond the EU. Supply chains have visibly restructured to track carbon intensity.
碳被定價進每個決策。 CBAM 等效機制已擴散到歐盟以外。供應鏈已可見地重組以追蹤碳強度。
AI runs the operations. L3 autonomy is the norm; L4 is common at hyperscalers. Operations teams have shrunk and shifted from execution to oversight.
AI 跑運轉。 L3 自治是常態;L4 在超大規模業者普遍。運轉團隊已縮減並從執行轉到監督。
Vendor ecosystems remain bifurcated. Western and Chinese tracks have not converged. Taiwan continues to bridge, with growing pressure.
廠商生態仍分裂。 西方與中國軌道未收斂。台灣繼續橋接,壓力增加。
The aggregate picture is an industry that has shifted from being primarily an engineering discipline to being a coordination problem across regulation, supply chain, software, and geopolitics. The engineering challenges remain, but they are no longer the binding constraint.
1. Three forces are simultaneously reshaping the industry // 三股力量同時重塑這個產業 #
Prefabrication compresses build time. Sustainability tightens what can be built and where. Autonomy moves operations from human-driven to AI-driven. None of the three is reversible.
預製化壓縮建設時間。永續收緊可以建什麼與哪裡。自治把運轉從人類驅動轉到 AI 驅動。三者沒有可逆的。
2. PMDC has structurally aligned with the AI hardware cycle // PMDC 已結構性對齊 AI 硬體週期 #
When equipment refreshes every 18 months, a 27-month build is incompatible with the technology being installed. PMDC’s 6-to-11-month build is now the only way to deploy current-generation hardware while it is still current-generation.
3. CBAM is the first regulation translating carbon into direct commercial cost // CBAM 是把碳翻譯成直接商業成本的第一個法規 #
For data centers, this means steel and aluminum used in construction face carbon-equivalent tariffs at the EU border. Supply chains are visibly restructuring to track carbon intensity.
對數據中心而言這意味著建設用的鋼與鋁在歐盟邊境面臨碳當量關稅。供應鏈可見地重組以追蹤碳強度。
4. The nuclear comeback is real, not symbolic // 核能回歸是真實的,不是象徵性的 #
Microsoft + Three Mile Island, Amazon + Susquehanna, Google + Kairos SMRs. AI workloads need baseload that renewables cannot reliably supply; gas carries carbon liability; nuclear is the remaining option that meets both reliability and carbon constraints.
Microsoft + 三浬島、Amazon + Susquehanna、Google + Kairos SMR。AI 工作負載需要再生能源無法可靠提供的基載;天然氣帶碳責任;核能是同時滿足可靠性與碳約束的剩餘選項。
5. The PUE-WUE trade-off is now binding in dry regions // PUE-WUE 權衡現在在乾燥區域有約束力 #
Sites that built their PUE strategy around evaporative cooling are being forced to rethink as WUE caps spread. Direct liquid cooling and air-cooled chilled water are gaining favor in water-stressed markets.
把 PUE 策略建立在蒸發冷卻上的場址,隨著 WUE 上限擴散,被迫重新思考。直接液冷與氣冷冷凍水在缺水市場獲得青睞。
6. Vendor strategies divide into three patterns // 廠商戰略分成三個模式 #
Schneider plays ecosystem (EcoStruxure spanning DC + building + grid). Vertiv plays equipment depth + service. Huawei plays vertical integration (equipment + software + AI). The hyperscalers play none of these — they design custom and contract Taiwanese ODMs.
7. The geopolitical bifurcation is structural // 地緣政治分裂是結構性的 #
Western and Chinese vendor ecosystems have separated since 2019 and continue to diverge. Taiwan bridges both, with growing friction. The bridging role is the single largest open question in global technology supply-chain planning.
8. By 2030, the binding constraints have moved upstream // 到 2030 年,綁定約束已上移到上游 #
Build time, equipment availability, and operations capacity were the constraints of the 2010s. By 2030, the constraints are grid connection, chip allocation, carbon caps, and water rights. The industry’s bottlenecks have moved from inside the building to the regulatory and supply-chain environment around it.
The thirteenth and final article in this series moves from global trends to a single regional deep-dive: Sydney, Australia. The article combines all the frameworks introduced earlier — the five-layer architecture, the TCO economics, the supply chain map, the reliability and efficiency metrics, the construction and commissioning process, the site-selection scoring framework, the trend forces — and applies them to one specific data center market. It covers Australian and NSW regulatory frameworks, AEMO’s National Electricity Market dynamics, the NABERS Energy for Data Centres rating system, the major operators (NEXTDC, AirTrunk, Macquarie Data Centres, plus hyperscalers AWS, Microsoft, Google), the geography of Sydney’s major data center clusters (Eastern Creek, Macquarie Park, Mascot, Pyrmont, Lane Cove West, Homebush), and a practical guide for anyone evaluating Sydney as a build location. The article is intentionally written for two audiences: investors and operators considering the Sydney market, and curious readers wanting to understand how a real data center market actually works.
本系列第 13 篇也是最後一篇,從全球趨勢移到單一區域深入:澳洲雪梨。文章結合前面介紹的所有框架 —— 五層架構、TCO 經濟學、供應鏈地圖、可靠性與能效指標、建設與調試流程、選址評分框架、趨勢力量 —— 應用到一個特定的數據中心市場。它涵蓋澳洲與新南威爾斯州法規框架、AEMO 國家電力市場動態、NABERS Energy for Data Centres 評等系統、主要營運者(NEXTDC、AirTrunk、Macquarie Data Centres,加上超大規模業者 AWS、Microsoft、Google)、雪梨主要數據中心聚落的地理(Eastern Creek、Macquarie Park、Mascot、Pyrmont、Lane Cove West、Homebush)、以及給任何評估雪梨作為建設地點的人的實用指南。文章刻意為兩個受眾寫:考慮雪梨市場的投資人與營運者,與想了解一個真實數據中心市場實際怎麼運作的好奇讀者。